- What is an ArcGIS flood map?
- An ArcGIS flood map is an interactive, digital geographic information system GIS tool displaying areas prone to flooding, leveraging diverse data sources for detailed visual analysis of flood risk.
- How do ArcGIS flood maps differ from FEMA maps?
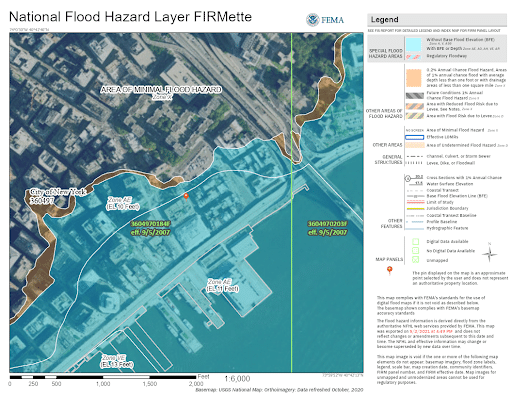
- ArcGIS is a platform that can host and display FEMA maps, along with other local and state data. FEMA maps are the federal standard for flood insurance and regulatory purposes. ArcGIS integrates and visualizes this data.
- Can I see my property's flood risk on an ArcGIS map?
- Yes, by inputting an address or parcel ID, you can typically pinpoint your property and view its specific flood zone designation and associated risk level as depicted on the ArcGIS platform.
- Are ArcGIS flood maps updated frequently?
- Updates depend on the data source. FEMA maps are periodically revised, and local ArcGIS implementations reflect these updates. Real-time conditions are sometimes integrated via weather overlays for immediate situational awareness.
- How can I access historical flood data using ArcGIS?
- Many ArcGIS portals include layers for historical flood events or high-water marks. Search for 'historical flood layers' or 'past inundation' within the map's available data options to find relevant information.
- What does a 100-year flood plain mean in ArcGIS?
- A 100-year flood plain, visualized in ArcGIS, represents an area with a 1% chance of flooding in any given year. It does not mean flooding will only occur once every 100 years.
- Can I embed ArcGIS flood maps on my website?
- Yes, developers and organizations can embed interactive ArcGIS flood maps using ArcGIS APIs and web viewers. This requires licensing and technical integration to display relevant data on external platforms.
Understanding flood risk is critical for property owners and community planners across the United States. The ArcGIS platform offers powerful, interactive flood maps that provide up-to-date insights into potential inundation areas, historical flood events, and future projections. These digital tools are essential for Gen Z and Millennial audiences seeking immediate, reliable information on their mobile devices. Whether you are buying a home, planning new developments, or simply want to assess your property's vulnerability, ArcGIS flood maps offer a comprehensive visual guide. They leverage vast datasets from sources like FEMA to deliver detailed geographic information system GIS data, empowering users to make informed decisions for safety and investment. Navigating these resources efficiently means accessing precise data quickly, a vital capability for those prioritizing preparedness and informed action against environmental changes. This guide provides actionable steps to utilize these critical mapping tools effectively.
- How do I find the nearest public ArcGIS flood map viewer for my location? - To locate the nearest public ArcGIS flood map viewer, begin by visiting your county or city government's official website. Look for departments like Planning, Emergency Management, or GIS Services. Many municipalities in the US provide direct links to interactive ArcGIS-powered flood maps for residents, offering detailed insights into local flood zones and potential risks.
- Can I download or print high-resolution ArcGIS flood map images for personal use? - Yes, most official ArcGIS flood map portals offer options to download or print high-resolution images. Look for 'Export Map' or 'Print' functionalities within the viewer interface, typically allowing formats like PDF or JPEG. Verify copyrights for any commercial use. These printable images are valuable for personal planning or sharing during community meetings.
- What makes ArcGIS flood maps essential for property buyers in flood-prone areas? - ArcGIS flood maps are essential for property buyers in flood-prone areas because they visually delineate specific flood zones, potential inundation depths, and historical flood data. This crucial information allows buyers to assess long-term risks, understand insurance requirements, and make informed decisions about property investments before purchase, protecting their assets and ensuring safety.
- How often are the flood risk layers updated on ArcGIS platforms? - The flood risk layers on ArcGIS platforms are updated based on the source data provider, typically federal agencies like FEMA, or local government studies. FEMA maps are periodically revised through comprehensive studies, and these updates are then integrated into ArcGIS. Always check the map's metadata or accompanying documentation for the most recent revision date of the displayed flood zones.
- What data sources power the accuracy of ArcGIS flood maps for US residents? - ArcGIS flood maps for US residents are powered by diverse authoritative data sources, including the Federal Emergency Management Agency (FEMA)'s Flood Insurance Rate Maps (FIRMs), National Weather Service (NWS) precipitation data, USGS stream gauges, and local municipal topographic surveys. These combined datasets contribute to the precision of flood risk assessments and visualizations within the platform.
- Are there mobile applications available to view ArcGIS flood maps on the go? - Yes, many government entities and private organizations provide mobile applications or highly responsive web-based ArcGIS viewers for flood maps. These apps offer convenient on-the-go access to flood zone information, real-time alerts, and property-specific risk assessments directly on smartphones or tablets, crucial for immediate situational awareness and planning during events.
- How can businesses use ArcGIS flood maps for risk management and site selection? - Businesses utilize ArcGIS flood maps for robust risk management and strategic site selection by identifying areas vulnerable to flooding, assessing potential impacts on infrastructure, and planning mitigation strategies. This geospatial intelligence helps in supply chain resilience, insurance cost estimations, and ensuring new developments are located in lower-risk zones, protecting investments and operations.
For property owners and community leaders across the United States, understanding flood risk is paramount. ArcGIS flood maps provide a robust digital solution, offering crucial insights into potential flood zones and historical inundation data. These tools are indispensable for navigating environmental challenges and making informed decisions, especially for younger generations who rely on accessible, visual information.
Frequently Asked Questions
Where can I find the most accurate ArcGIS flood maps locally?
The absolute best locations are typically official county or city GIS portals, often linked from your local government's planning or emergency management department websites. Also check the FEMA Flood Map Service Center for authoritative federal data integrated into ArcGIS platforms. Many states also host their own statewide GIS data hubs.
Can I view ArcGIS flood map images on my phone or get printable versions?
Yes, pull up your preferred mobile images app or web browser to navigate ArcGIS Online or specific agency portals. Most platforms offer interactive views optimized for mobile. For printable versions, look for a 'print' or 'export' option within the map viewer, usually allowing PDF or image downloads, ideal for sharing or offline reference.
What are the best times to consult ArcGIS flood maps for property buying?
Consult ArcGIS flood maps early in the property research process, ideally before making an offer. Reviewing flood data should be a priority during due diligence. Utilize these maps during normal business hours to contact local GIS departments if you have specific questions, ensuring you get the most comprehensive information available for your potential investment.
- FEMA Flood Map Service Center - National (Online Portal)
- State GIS Portals (e.g., California Geoportal, Texas Natural Resources Information System) - Statewide Coverage
- County Assessor / Planning Department Websites (e.g., Miami-Dade County, King County WA) - Local Jurisdictions
All images focus on ArcGIS flood map visuals illustrating flood zones, risk levels, and property impacts.
Interactive flood mapping tools, real-time risk assessment, property specific flood data, comprehensive GIS integration, community planning and preparedness, mobile accessibility for quick insights.


Arcgis Hub Exp Flood Outlook 032126 1423 032126 1423 Location Infused Data Informs Sound Strategies Spring 2026 Arcnews Article Richlocation How To Perform Analysis In Pro Youtube Maxresdefault SANSA Continues Support Response Limpopo Through Satellite Giyani Map 21JAN Create And Export Simulation For Adyar River Basin Using What S New Platform January 2026 35F22E 0527429e94264462b5793d0ee1be571amv2 35F22E 0527429e94264462b5793d0ee1be571amv2 Understanding The 2026 Is Your House At Risk 2026 Essc Gis Powered Jakarta Portal KMGDZG APF77 APR21 REPORT JM APF77 APR21 COMMUNICATION STORYMAPS MDPI 5890533 Of An Area Modeling XSVCZQ 2D 3D Impact Scaled 2D 3D.


HOW TO MAKE FLOOD HAZARD MAP USING Arcgis PRO PART Youtube Maxresdefault Inundation Mapping In Texas Harvey Zone FEMA Maps Houston Explained See Rawimage Simulation And Modeling Develop A Risk Create Advance Assessing With GIS Blogs AGSRT 5d1736 690fe89b61794099b2c3e2fd23271381mv2 5d1736 690fe89b61794099b2c3e2fd23271381mv2 Understanding The 2026 FCERM Funding Policy Updates FPS Environmental For Planning Zones Minute Floods Online Living Atlas Fld AHP GISTUBE1896 Susceptibility Complete Tutorial.


Floodplain Maps Data Flood Map For Planning Enhanced And New Features Coming March 2025 How To Use Arcgis Pro Susceptibility Geography Realm Risk Arcgispro Oppong Mapping W QGIS Earth Activist Training Jan Rectangle Management In 2026 Key Developments Preparing The Unnamed Fema Texas 2024 Zones USA Hazard Areas THUMBNAIL1741898052684 National Weather Service Office Of Water Prediction Sfo Final 2026 Outlook Real Watchlist Where Hits Next 2026 Visualizing Floods That Defined Early 2026 Transcoded 00001 GIS Per La Sostenibilit Simulation One Team Copertina Floodsimulation.